Reports for Spectrumdata services
The company develops services for verifying various types of data for both B2B and B2C clients. In both cases, the result of the verification is a report that helps users fulfill their main need: deciding whether the person, machine, or company being checked meets their requirements or not.
Role
Product designer
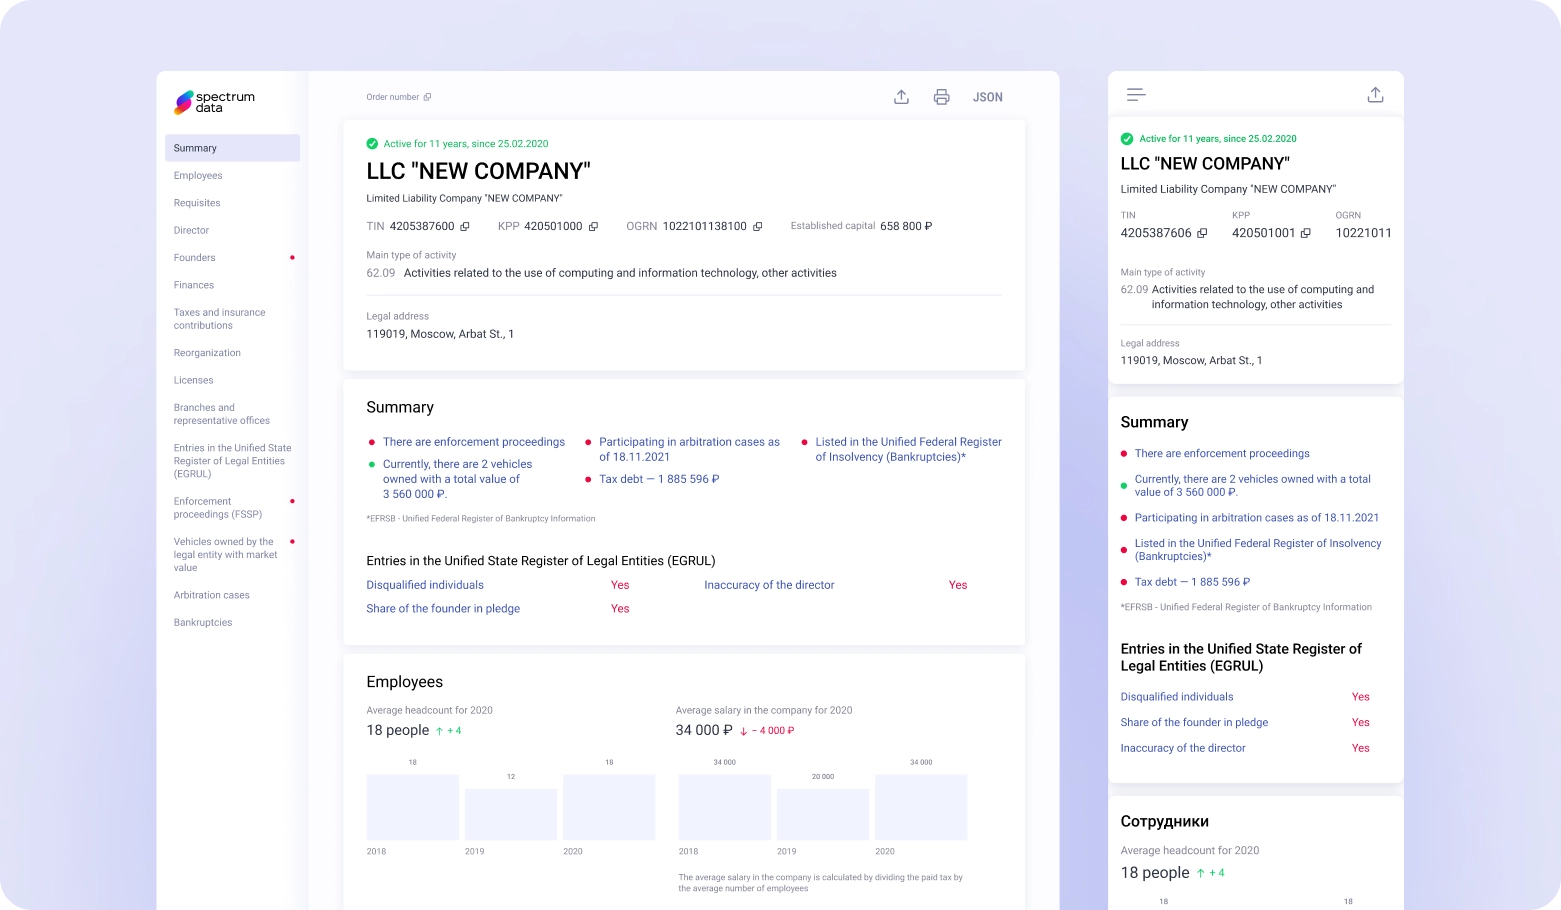
Platform
Desktop, mobile
Scope
Redesign, working with metrics, data visualization
Users
The primary target audience includes HR professionals, security service employees, car dealers, managers, and business owners.
Context & problems
The reports are used across several company services and have a broad audience. Since the data in the reports is highly valuable to users, complaints about difficulties in interaction prompted us to investigate the issue and work on a solution.
Working alongside the product manager, I conducted interviews with current users and also gathered feedback from the support team and the sales department.
After analyzing the data from the research and corridor testing, I defined the problems to solve, the users' goals, business objectives, and the expected results.
What I found:
- The data is unstructured and overwhelming, making it hard to quickly extract key information.
- Users have to scroll a lot, which causes them to lose focus and makes it difficult to navigate the page.
- Slow TTM for new blocks (B2B). Clients want to integrate and start using new verification blocks as quickly as possible.
The expected outcome after the redesign:
- The data is easy to scan for a quick assessment of the results, with the option to view detailed information immediately if needed.
- Fast report loading, with the ability to print or share it.
- Clear and simple navigation, as the number of verification blocks is flexible.
- Reduced development time for blocks, from task assignment to production rollout.
Process
Once the context was clear and the problems were defined, I began generating ideas and hypotheses to solve them. I created sketches and prototypes, testing them along the way. Based on feedback, I refined and made changes. At this stage, there was a lot of teamwork—we met, discussed, and critiqued each other's work. I presented the final versions to stakeholders for approval.
What I did to improve the usability of the report:
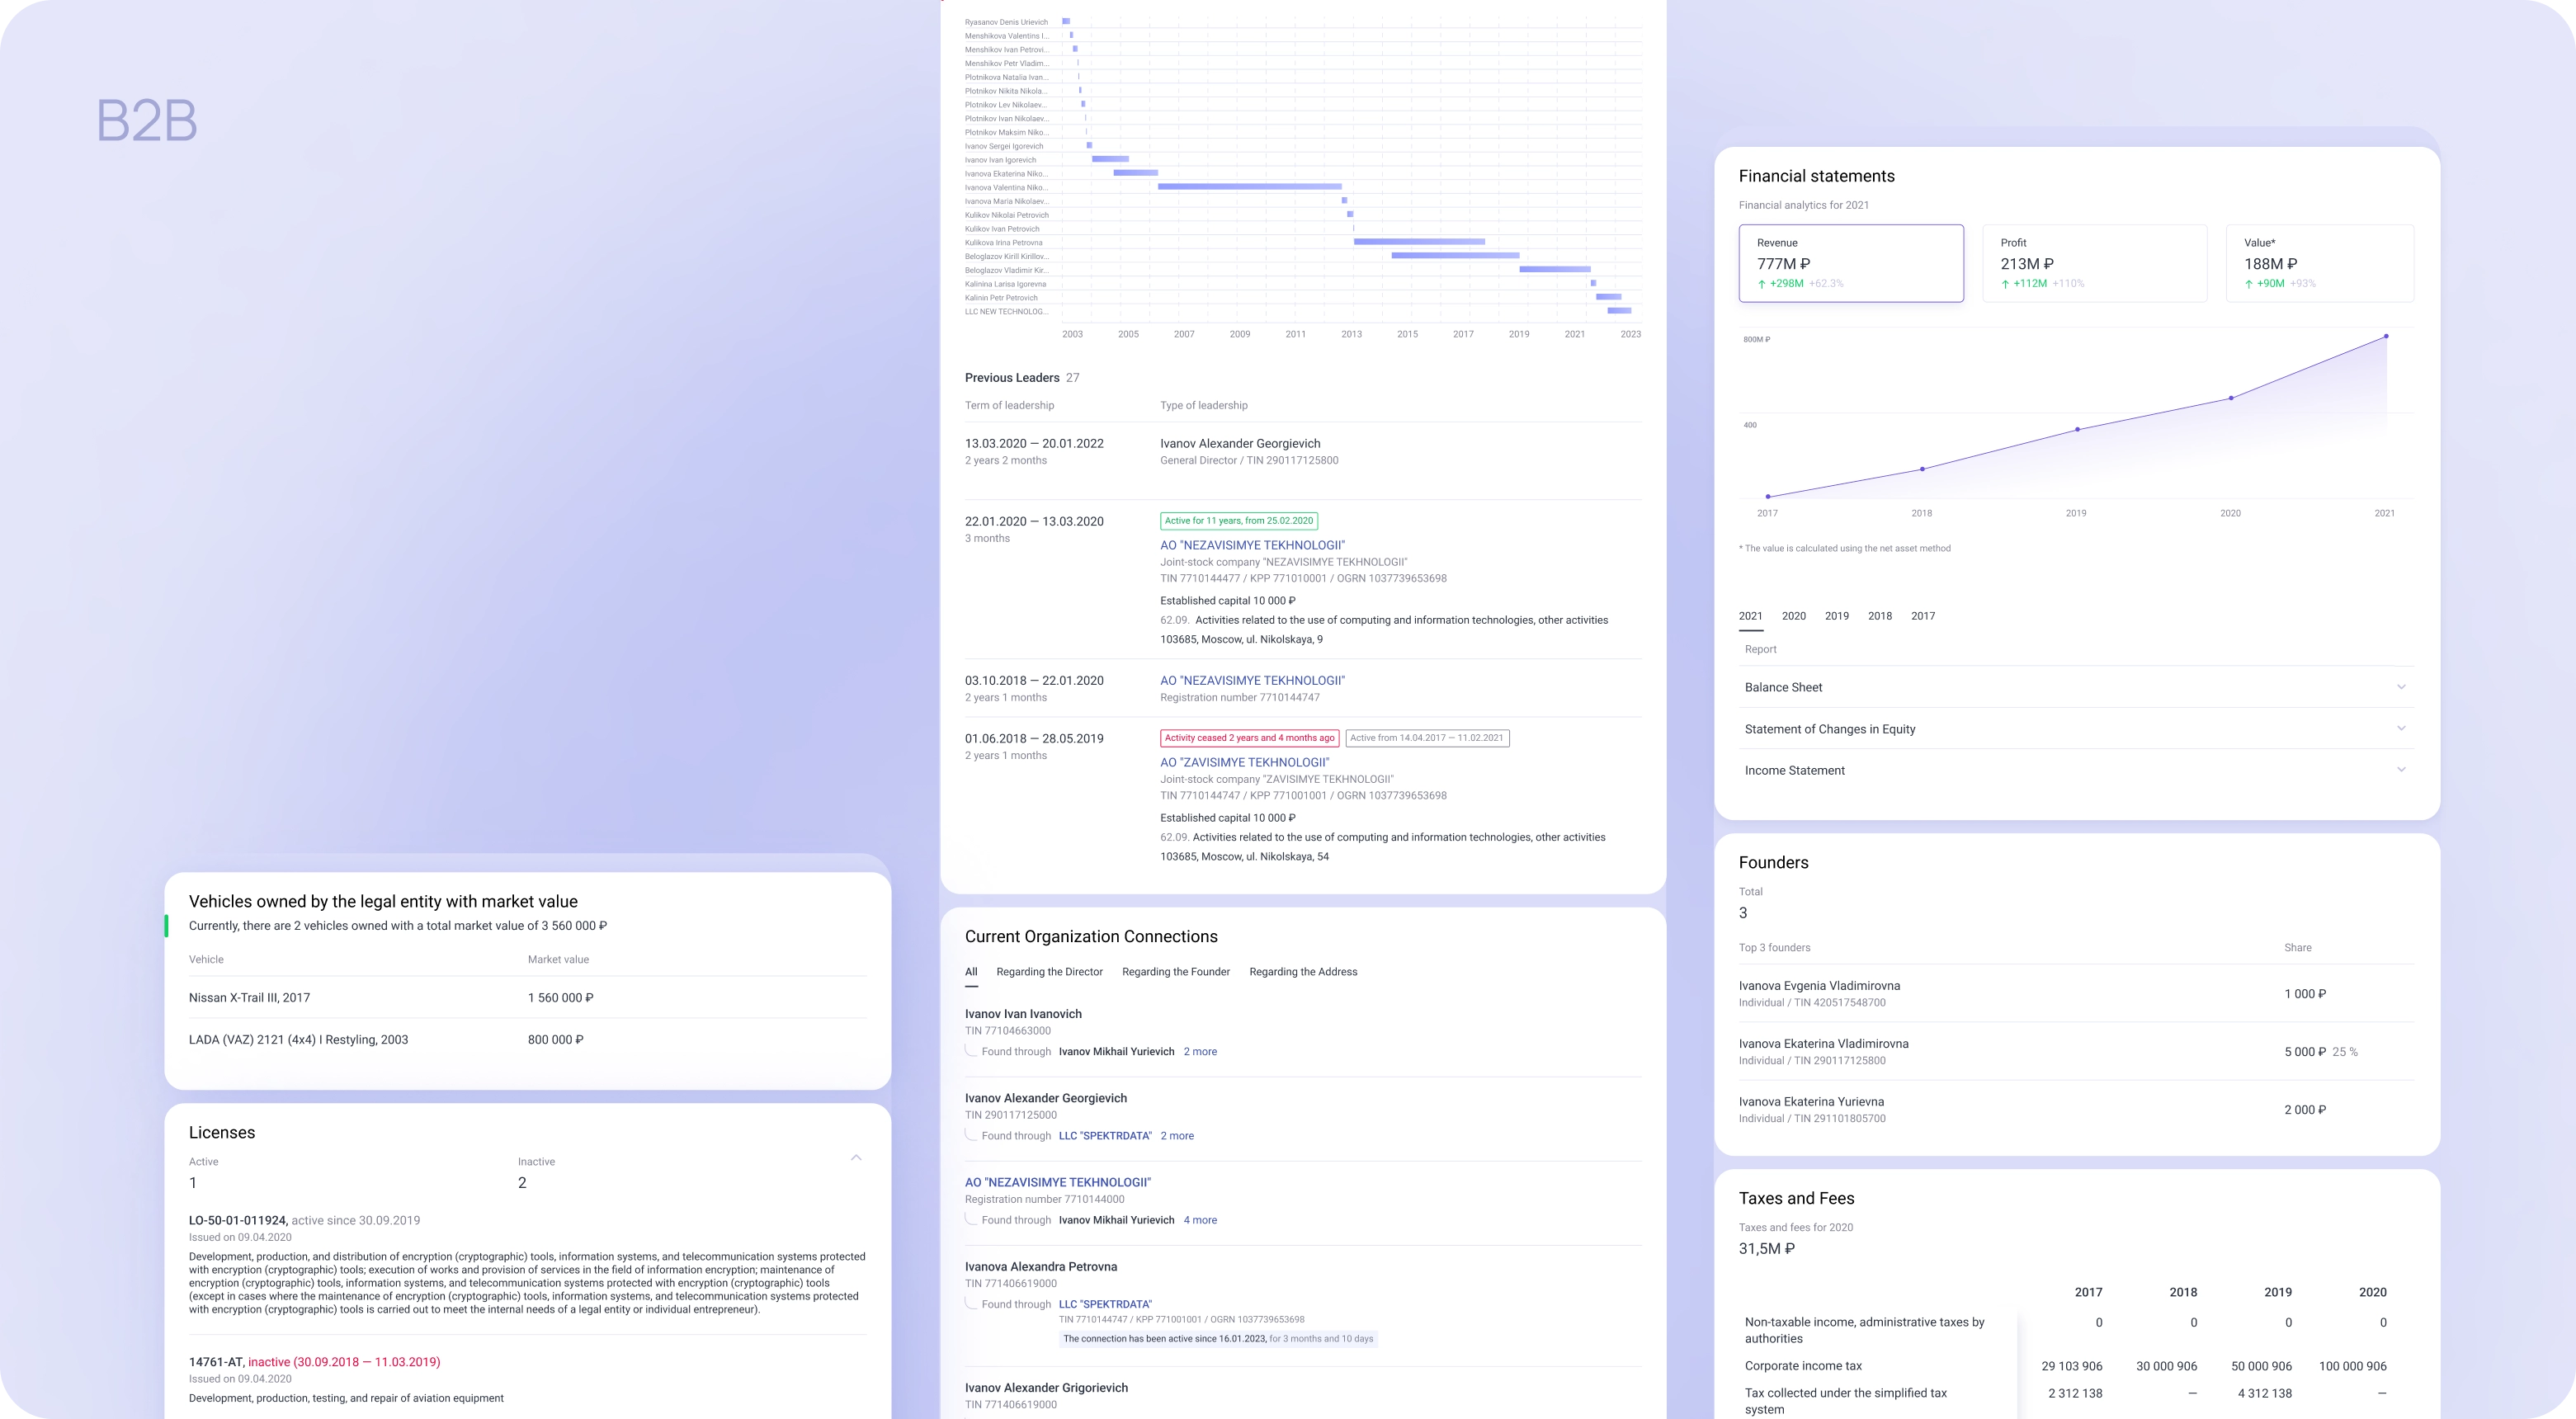
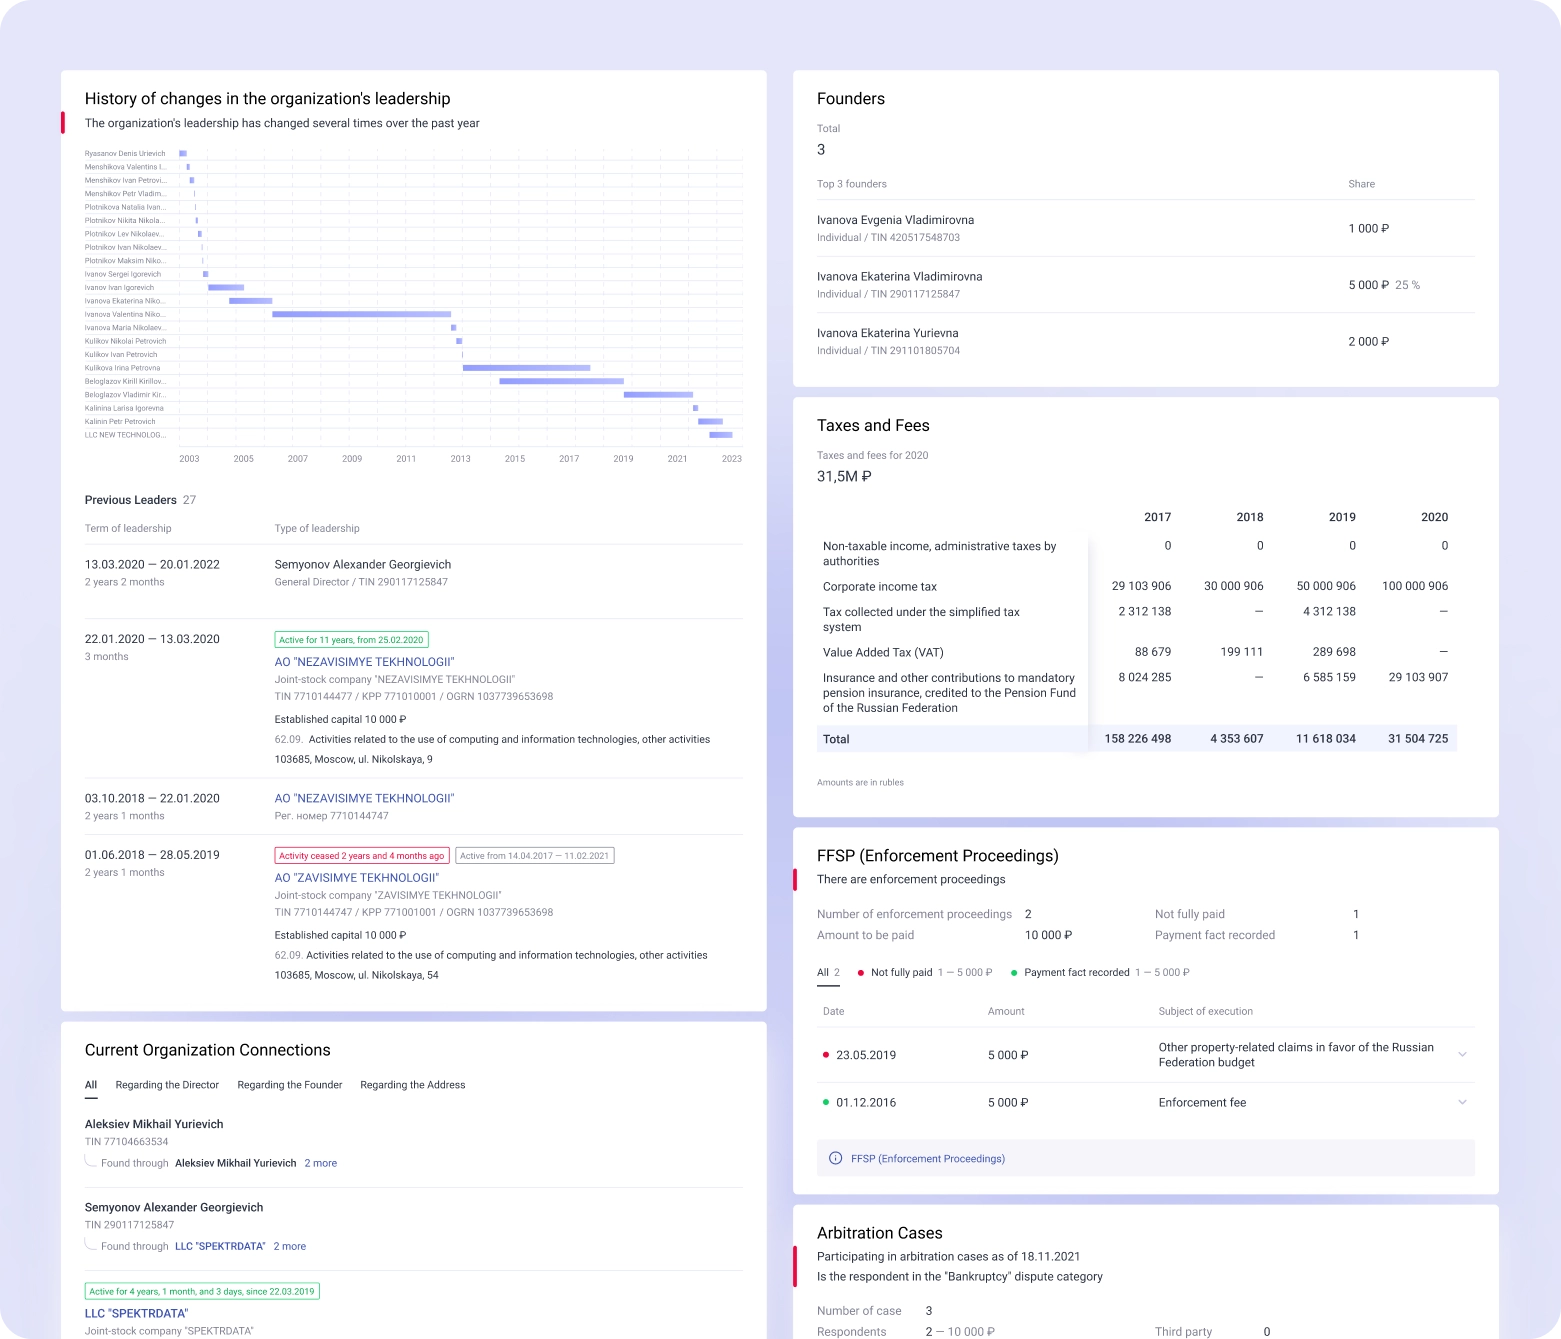
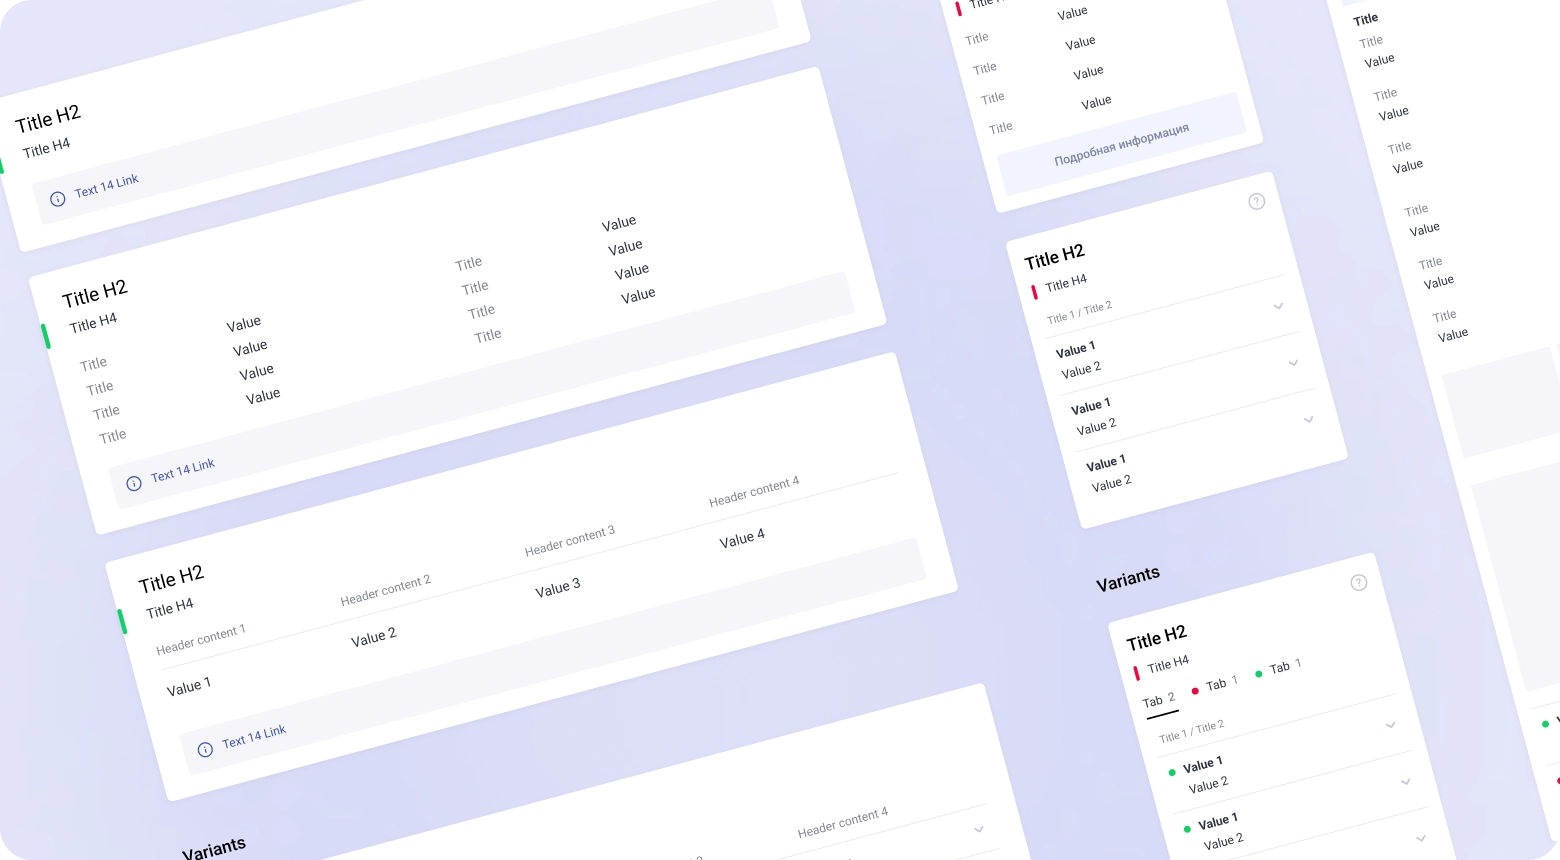
- Built a visual hierarchy using headings, spacing, and color to improve readability.
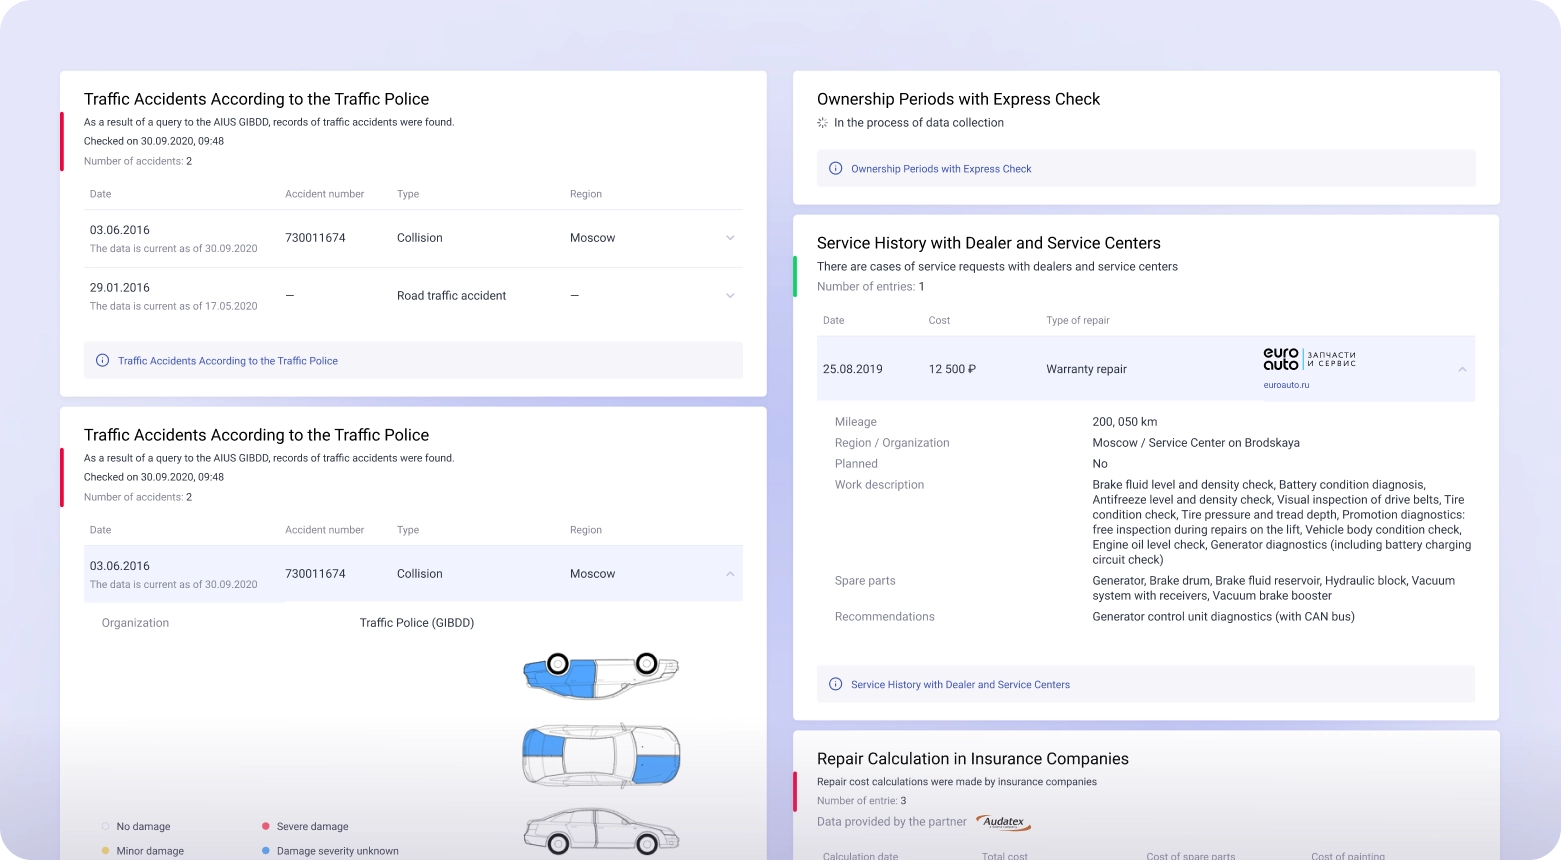
- Added color indicators to quickly assess the verification result: red for attention needed, green for everything in order.
- Created table components to solve the issue of long scrolling and organize the information
What I did to reduce TTM:
- Created different template variations for standard blocks, covering most use cases. The exceptions are blocks where the data doesn't fit the standard template or require customization with charts or diagrams for visualization.
- Developed a design system that the development team successfully implemented.
Result
User satisfaction with the reports increased, and the number of reports requested in the service grew by 100% over the year.
TTM improved by 30%, and the development of new blocks now takes from 4 hours to a few days. Additionally, the workload on the designer has decreased, as developers can now directly implement data into templates without the designer's involvement.
The structure and templates of blocks are reused in other projects, helping to reduce development resources, saving time and money.
Next project

